Слова и выражения, употребляемые при описании направлений:
Направление
глаголы
существительные
Rise (to)
Increase (to)
Climb (to)
Boom
Go up (to)
Grow (to|)
Peak (at)
A rise
An increase
A climb, growth
An upward
trend
A boom (a dramatic rise)
(reach) a peak (at)
Fall (to)
Decline (to)
Decrease (to)
Dip (to)
Drop (to)
go down (to)
Slump(to)
Reduce (to)
A decrease
A decline
A fall
A drop
A slump (a
dramatic fall)
A reduction
Level out (at)
Did not change
Remain stable (at)
Remain steady (at)
Stay constant (at)
Maintain the same level
A levelling out
No change
Fluctuated (around)
Peaked (at)
Plateaued (at)
Stood at (we use this phrase to focus on a particular point,
before we mention the
movement, for example:
In the first year, unemployment
stood at … )
A fluctuation
Reached a
peak (of)
Reached at
plateau (at)
Слова, характеризующие степень изменения направления
just under, just over
well under, well over
roughly, nearly
approximately, around
about
Примеры:
Figure 1 shows sales of mobile phones per month. As can be seen, it covers the years 1998 to 2001 and shows that the sales of mobile phones declined steadily in 1998, then remained steady from May until the end of the year. The sales rose more and more steeply, throughout 1999, with a steep increase at the end of the year, and reached a peak of 6,200 in February 2000. A sharp fall followed but sales levelled off at about 5,300 per month in April, fluctuated slightly through the year, and are now increasing again. The figures seem to indicate that we have recovered from the problems in mid-2000 and are on target to improve on our February 2000 peak by the end of 2002.
The graph shows the rate of smoking in Someland. In 1960, 600 men in every 1,000 were smoking. This number decreased gradually to 500 by 1974 and continued to decrease but more steeply to 300 in 1995. In contrast the rate of women smokers in 1960 was very low at only 80 in every 1,000. This number increased to 170 by 1968 and increased again but more steeply to 320 in 1977. The rate of female smokers then remained stable at 320 until 1984 at which point the figures began to decline and had dropped to 250 by 1995.
Proportion of students
The chart shows the grades obtained by students in a class. Overall almost 90% of the students passed. More than half of the students obtained a very good grade, with 21% getting a distinction and 33% getting a merit grade. Only 8 % of the students failed.
Uses of Apples USA
The graph compares the chief uses of the apple crop in the US. Overall, the bulk of the harvest is either eaten fresh or made into juice. The biggest slice of the pie-chart is taken up by fresh fruit. About 60% of the crop is eaten fresh. This is three times as much as the next use, which is for juice. Less than 20% of apples in the US are turned into apple juice. A further 12% is canned and a total of 5% is either frozen or dried. Other remaining uses such as apple vinegar, account for just 5% of the crop.
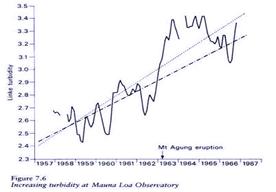
Figure 7.6 shows that the average turbidity factor for the atmosphere (Linke turbidity) has increased by 30 per cent in a decade (the dot-and-dash line). It also shows the effect of a natural source of turbidity, the Mount Agung (Bali) eruption of 1963 (the single, continuous line). In the figure the dotted line represents the linear trend for the same period if the effects of the eruption are excluded from the computations.


 Proportion of students
 Uses of Apples USA